Good morning everyone,
I am new to Girder and web development in general so I have a question that is maybe trivial:
I am used ,when coding in Python (or whatever language), to debug from the IDE or sometimes from an external debugger.
How do I achieve this with Girder ?
Example : I am coding a plugin in PyCharm, using the Swagger interface to try operations. I now want to be able to place a breakpoint, execute code step by step and inspect some variable values.
Thank you very much.
Edern
What I usually do to debug Girder is to install ipdb and insert a breakpoint:
import ipdb
ipdb.set_trace()
This will stop the server when it hits this line of code and give you an ipython prompt. This also works with other terminal based debuggers like pudb.
I don’t have any experience using PyCharm or other graphical IDE’s. I suspect the challenge will be to get it to spin up the Girder server. I think there are other Girder developers who use PyCharm that may be able to give you more specific advice.
Debugging With VIsual Studio Code
- Open up the
girder folder in Visual Studio code and make sure your plugin is present in the plugins directory.
- Open
__main__.py in the rootgirder` directory
- Click the
Debug top menu item
- Click
Start Debugging
You should now see girder starting up in the console. Add breakpoints to your plugin code and they should get hit. The only issue is that stepping over, into, out of will continue program execution. To get around this, place breakpoints on the fly and just click continue/the green arrow when you want to hit the next breakpoint.
I tried to do this with PyCharm and was unsuccessful.
Thank you for your answers. For now, I guess I will just use vscode for debugging. I could not find a way to do trigger breakpoints in PyCharm.
Hi everyone,
I am reviving this thread to update it for Girder 3. The usual v2 methods do not seem to be relevant anymore.
How should we launch debugging with girder3 + plugins on Visual Studio Code for instance ?
Thanks.
Edern
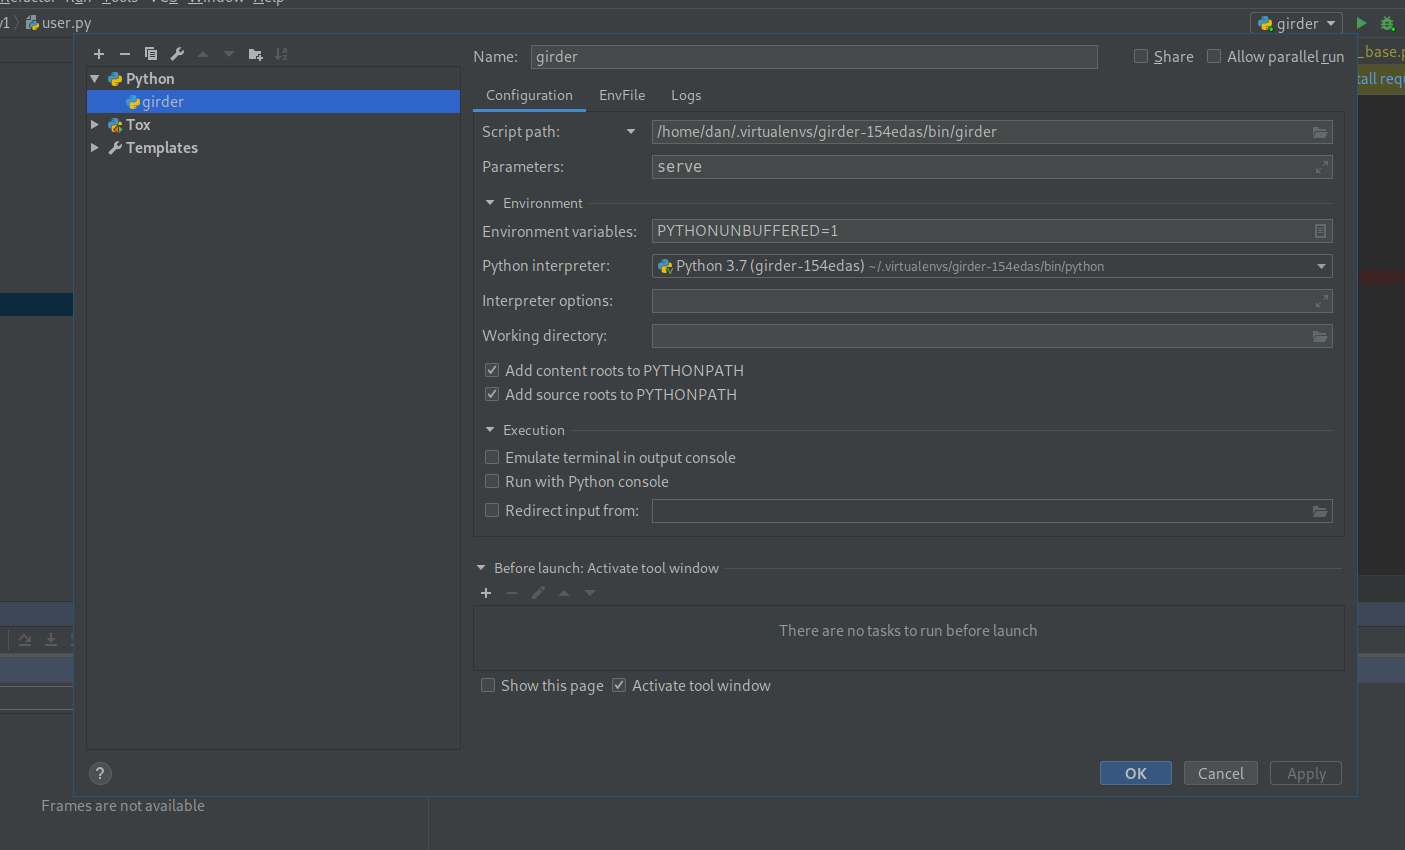
I don’t think anything has changed from Girder 2 -> 3 in terms of debugging. I don’t use visual studio, but I just tested debugging with visual breakpoints works PyCharm and Girder 3, this is a screenshot of my configuration:
The only configuration I customized was the first 2 fields, script path and parameters. Note the script path must be absolute and not relative to your project interpreter.
1 Like